Troubleshoot universe issues
YugabyteDB Anywhere allows you to monitor and troubleshoot issues that arise from universes.
Use metrics
Monitor performance metrics for your universe to ensure the universe configuration matches its performance requirements using the universe Metrics page.
The Metrics page displays graphs representing information on operations, latency, and other parameters accumulated over time. By examining specific metrics, you can diagnose and troubleshoot issues.
You access metrics by navigating to Universes > Universe-Name > Metrics.
For information on the available metrics, refer to Performance metrics.
Use nodes status
You can check the status of the YB-Master and YB-TServer on each YugabyteDB node by navigating to Universes > Universe-Name > Nodes, as per the following illustration:
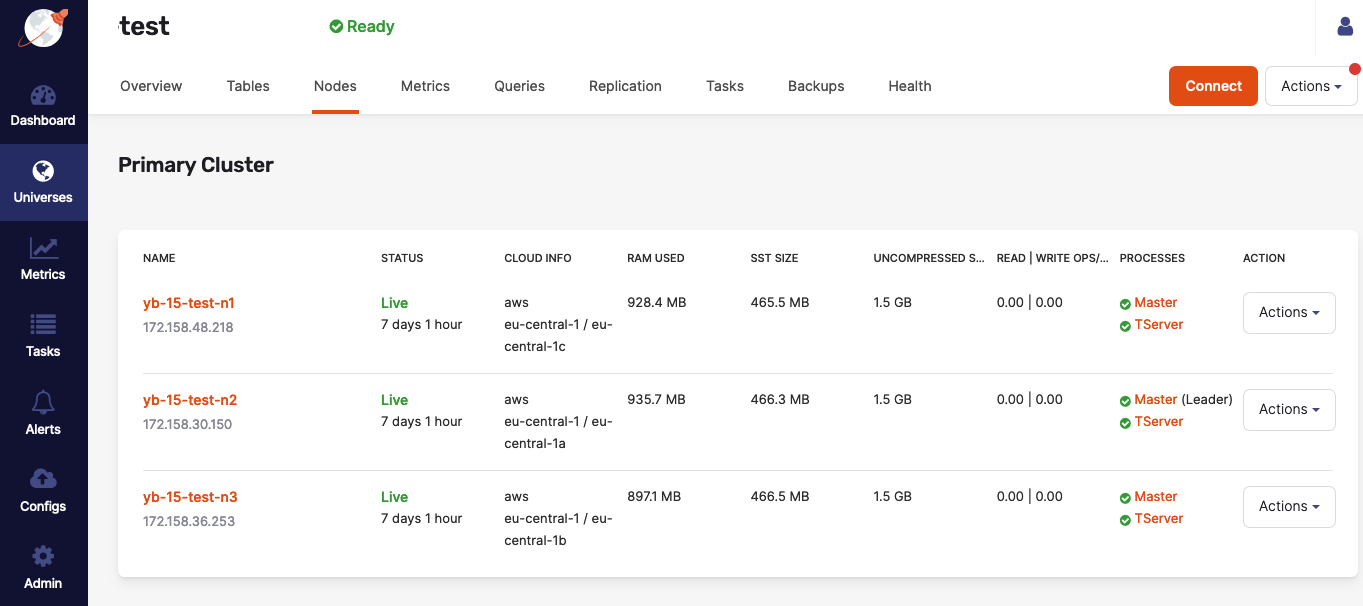
If issues arise, additional information about each master and YB-TServer is available on their respective Details pages, or by accessing <node_IP>:7000 for YB-Master servers and <node_IP>:9000 for YB-TServers (unless the configuration of your on-premises data center or cloud-provider account prevents the access, in which case you may consult Check YugabyteDB servers).
Check host resources on the nodes
To check host resources on your YugabyteDB nodes, run the following script, replacing the IP addresses with the IP addresses of your YugabyteDB nodes:
for IP in 10.1.13.150 10.1.13.151 10.1.13.152; \
do echo $IP; \
  ssh $IP \
    'echo -n "CPUs: ";cat /proc/cpuinfo | grep processor | wc -l; \
      echo -n "Mem: ";free -h | grep Mem | tr -s " " | cut -d" " -f 2; \
      echo -n "Disk: "; df -h / | grep -v Filesystem'; \
done
The output should look similar to the following:
10.1.12.103
CPUs: 72
Mem: 251G
Disk: /dev/sda2       160G   13G  148G   8% /
10.1.12.104
CPUs: 88
Mem: 251G
Disk: /dev/sda2       208G   22G  187G  11% /
10.1.12.105
CPUs: 88
Mem: 251G
Disk: /dev/sda2       208G  5.1G  203G   3% /
Troubleshoot universe creation
You typically create universes by navigating to Universes > Create universe > Primary cluster, as per the following illustration:
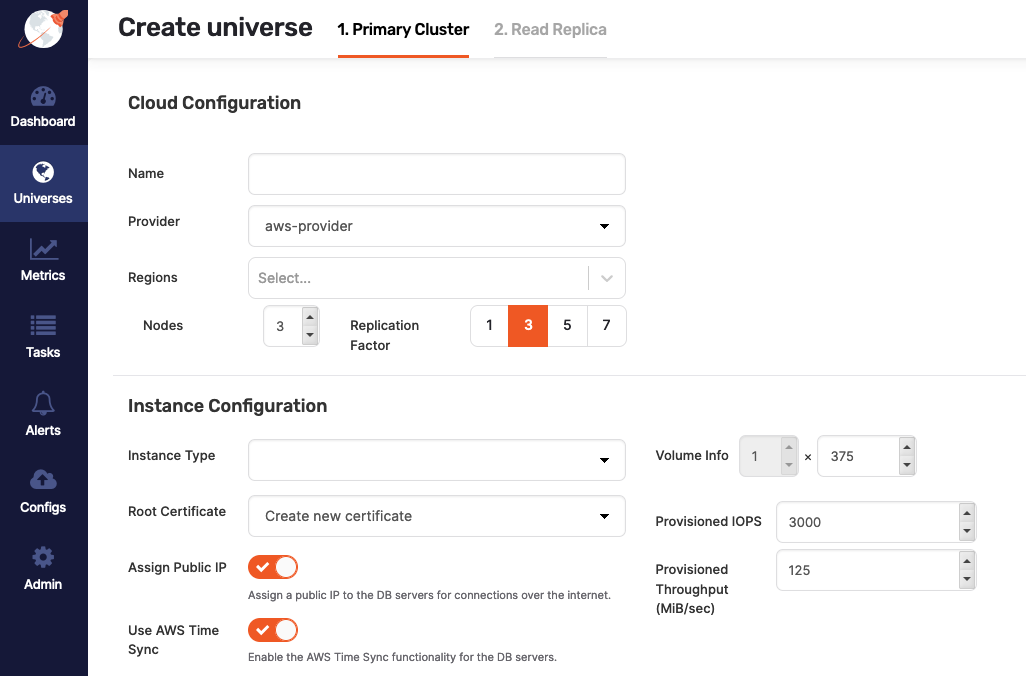
If you disable Assign Public IP during the universe creation, the process may fail under certain conditions, unless you either install the following packages on the machine image or make them available on an accessible package repository:
chrony, if you enabled Use Time Sync for the selected cloud provider.python-minimal, if YugabyteDB Anywhere is installed on Ubuntu 18.04.python-setuptools, if YugabyteDB Anywhere is installed on Ubuntu 18.04.python-sixorpython2-six(the Python2 version of Six).policycoreutils-python, if YugabyteDB Anywhere is installed on Oracle Linux 8.selinux-policymust be on an accessible package repository, if YugabyteDB Anywhere is installed on Oracle Linux 8.locales, if YugabyteDB Anywhere is installed on Ubuntu.
The preceding package requirements are applicable to YugabyteDB Anywhere version 2.13.1.0.
If you are using YugabyteDB Anywhere version 2.12.n.n and disable Use Time Sync during the universe creation, you also need to install the ntpd package.
Use support bundles
A support bundle is an archive generated at a universe level. It contains all the files required for diagnosing and troubleshooting a problem. The diagnostic information is provided by the following types of files:
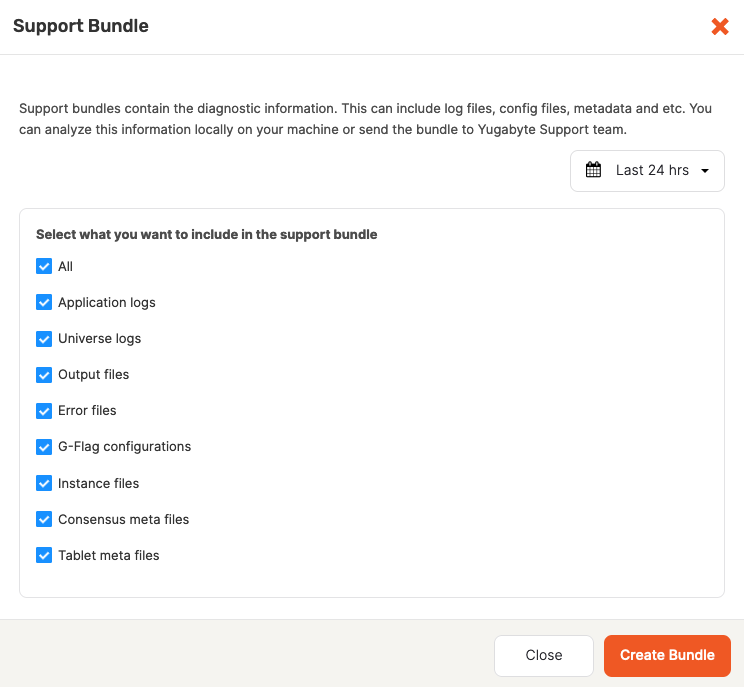
- Application logs from YugabyteDB Anywhere.
- Universe logs, which are the YB-Master and YB-TServer log files from each node in the universe, as well as PostgreSQL logs available under the YB-TServer logs directory.
- Output files (
.out) files generated by the YB-Master and YB-TServer. - Error files (
.err) generated by the YB-Master and YB-TServer. - G-flag configuration files containing the flags set on the universe.
- Instance files that contain the metadata information from the YB-Master and YB-TServer.
- Consensus meta files containing consensus metadata information from the YB-Master and YB-TServer.
- Tablet meta files containing the tablet metadata from the YB-Master and YB-TServer.
The diagnostic information can be analyzed locally or the bundle can be forwarded to the Yugabyte Support team.
You can create a support bundle as follows:
-
Open the universe that needs to be diagnosed and click Actions > Support Bundles.
-
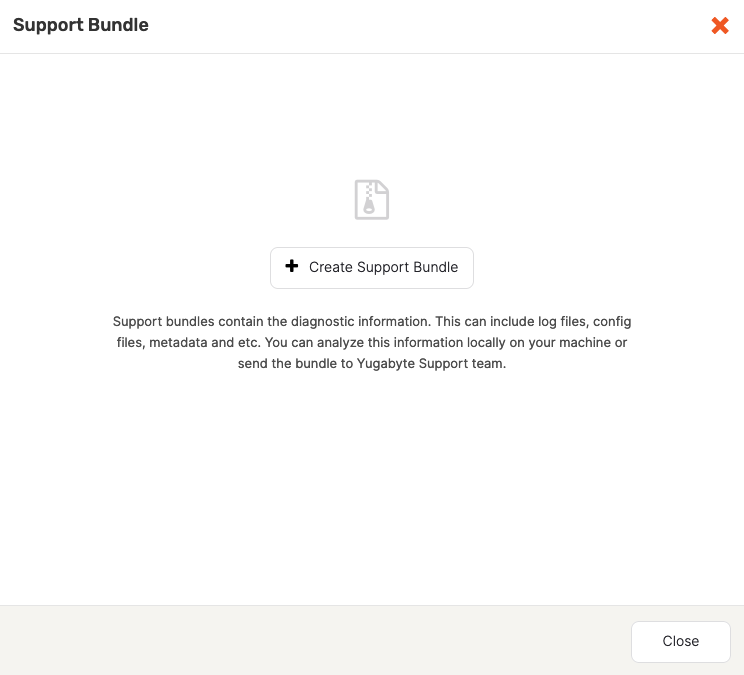
If the universe already has support bundles, they are displayed by the Support Bundle dialog. If there are no bundles for the universe, use the Support Bundles dialog to generate a bundle by clicking Create Support Bundle, as per the following illustration:
-
Select the date range and the types of files to be included in the bundle, as per the following illustration:
-
Click Create Bundle.
YugabyteDB Anywhere starts collecting files from all the nodes in the cluster into an archive. Note that this process might take several minutes. When finished, the bundle's status is displayed as Ready, as per the following illustration:
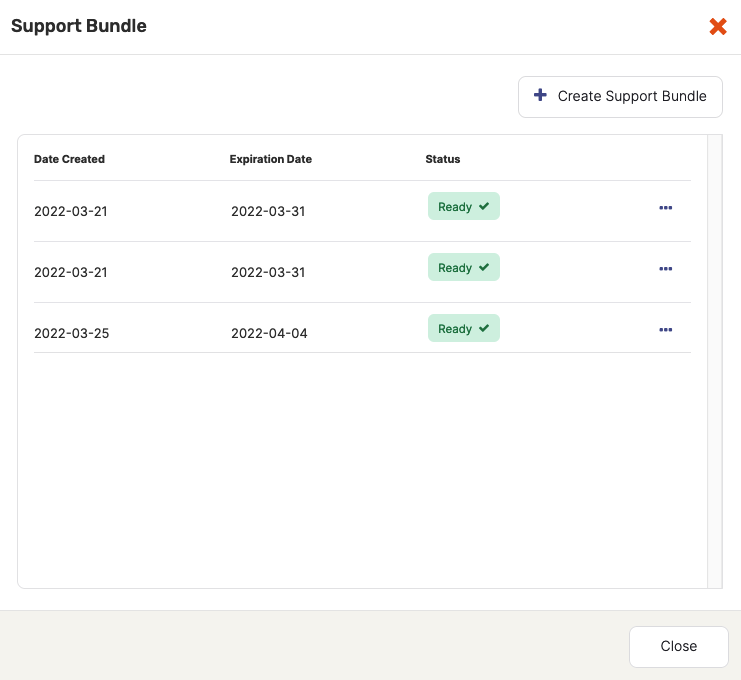
The Support Bundles dialog allows you to either download the bundle or delete it if it is no longer needed. By default, bundles expire after ten days to free up space.
Debug crashing YugabyteDB pods in Kubernetes
If the YugabyteDB pods of your universe are crashing, you can debug them with the help of following instructions.
Collect core dumps in Kubernetes environments
When dealing with Kubernetes-based installations of YugabyteDB Anywhere, you might need to retrieve core dump files in case of a crash in the Kubernetes pod. For more information, see Specify ulimit and remember the location of core dumps.
The process of collecting core dumps depends on the value of the sysctl kernel.core_pattern, which you can inspect in a Kubernetes pod or node by executing the following command:
cat /proc/sys/kernel/core_pattern
The value of core_pattern can be a literal path or it can contain a pipe symbol:
-
If the value of
core_patternis a literal path of the form/var/tmp/core.%p, cores are copied by the YugabyteDB node to a persistent volume directory that you can inspect using the following command:kubectl exec -it -n <namespace> <pod_name> -c yb-cleanup -- ls -lht /var/yugabyte/coresIn the preceding command, the
yb-cleanupcontainer of the node is used because the primary YB-Master or YB-TServer container may be in a crash loop.To copy a specific core dump file at this location, use the following kubectl
cpcommand:kubectl cp -n <namespace> -c yb-cleanup <yb_pod_name>:/var/yugabyte/cores/core.2334 /tmp/core.2334 -
If the value of
core_patterncontains a|pipe symbol (for example,|/usr/share/apport/apport -p%p -s%s -c%c -d%d -P%P -u%u -g%g -- %E), the core dump is being redirected to a specific collector on the underlying Kubernetes node, with the location depending on the exact collector. In this case, it is your responsibility to identify the location to which these files are written and retrieve them.
Use debug hooks with YugabyteDB in Kubernetes
You can add your own commands to pre- and post-debug hooks to troubleshoot crashing YB-Master or YB-TServer pods. These commands are run before the database process starts and after the database process terminates or crashes.
For example, to modify the debug hooks of a YB-Master, run following command:
kubectl edit configmap -n <namespace> ybuni1-asia-south1-a-lbrl-master-hooks
This opens the configmap YAML in your editor.
To add multiple commands to the pre-debug hook of yb-master-0, you can modify the yb-master-0-pre_debug_hook.sh key as follows:
apiVersion: v1
kind: ConfigMap
metadata:
  name: ybuni1-asia-south1-a-lbrl-master-hooks
data:
  yb-master-0-post_debug_hook.sh: 'echo ''hello-from-post'' '
  yb-master-0-pre_debug_hook.sh: |
    echo "Running the pre hook"
    du -sh /mnt/disk0/yb-data/
    sleep 5m
    # other commands here…
  yb-master-1-post_debug_hook.sh: 'echo ''hello-from-post'' '
  yb-master-1-pre_debug_hook.sh: 'echo ''hello-from-pre'' '
After you save the file, the updated commands will be executed on the next restart of yb-master-0.
You can run the following command to check the output of your debug hook:
kubectl logs -n <namespace> ybuni1-asia-south1-a-lbrl-yb-master-0 -c yb-master
Expect an output similar to the following:
...
2023-03-29 06:40:09,553 [INFO] k8s_parent.py: Executing operation: ybuni1-asia-south1-a-lbrl-yb-master-0_pre_debug_hook filepath: /opt/debug_hooks_config/yb-master-0-pre_debug_hook.sh
2023-03-29 06:45:09,627 [INFO] k8s_parent.py: Output from hook b'Running the pre hook\n44M\t/mnt/disk0/yb-data/\n'
Perform the follower lag check during upgrades
You can use the follower lag check to ensure that the YB-Master and YB-TServer process is caught up to its peers. To find this metric on Prometheus, execute the following:
max by (instance) (follower_lag_ms{instance='<ip>:<http_port>'})
- ip represents the YB-Master IP or the YB-TServer IP.
- http_port represents the HTTP port on which the YB-Master or YB-TServer is listening. The YB-Master default port is 7000 and the YB-TServer default port is 9000.
The result is the maximum follower lag, in milliseconds, of the most recent Prometheus of the specified YB-Master or YB-TServer process.
Typically, the maximum follower lag of a healthy universe is a few seconds at most. The following reasons may contribute to a significant increase in the follower lag, potentially reaching several minutes:
- Node issues, such as network problems between nodes, an unhealthy state of nodes, or inability of the node's YB-Master or YB-TServer process to properly serve requests. The lag usually persists until the issue is resolved.
- Issues during a rolling upgrade, when the YB-Master or YB-TServer process is stopped, upgrade on the associated process is performed, then the process is restarted. During the downtime, writes to the database continue to occur, but the associated YB-Master or YB-TServer are left behind. The lag gradually decreases after the YB-Master or YB-TServer has restarted and can serve requests again. However, if an upgrade is performed on a universe that is not in a healthy state to begin with (for example, a node is down or is experiencing an unexpected problem), a failure is likely to occur due to the follower lag threshold not being reached in the specified timeframe after the processes have restarted. Note that the default value for the follower lag threshold is 1 minute and the overall time allocated for the process to catch up is 15 minutes. To remedy the situation, perform the following:
- Bring the node back to a healthy state by stopping and restarting the node, or removing it and adding a new one.
- Ensure that the YB-Master and YB-TServer processes are running correctly on the node.