Slow Queries dashboard
Use the Slow Queries dashboard to analyze statistics of past queries on your YugabyteDB universes. You can use this data for the following:
- Visually identifying slower running database operations.
- Evaluating query execution times over time.
- Discovering potential queries for memory optimization.
All user roles — Super Admin, Admin, and Read-only — are granted permissions to use the Slow Queries dashboard.
Note that slow queries are not available for YCQL.
The following table describes the Slow Queries column values.
| Column | Description |
|---|---|
| Query | The query command. For example, select * from my_keyspace.my_table |
| Database | The YSQL database used by the query. |
| User | The name of role used to access YSQL database. |
| Count/ Total count | The total number of times this type of query has executed. |
| Total time | The total duration (in milliseconds) this query has taken. |
| Rows | The total number of database table rows returned across all iterations of this query |
| Avg Exec Time | Average or mean execution time (in milliseconds) for this query. |
| Min Exec Time | Minimum execution time (in milliseconds) for this query. |
| Max Exec Time | Maximum execution time (in milliseconds) for this query. |
| Std Dev Time | Standard deviation of execution times for this query. |
| Temp Tables RAM | Memory used by temporary tables generated from query. |
| P25 Latency | Latency with its 25th percentile. |
| P50 Latency | Latency with its 50th percentile. |
| P90 Latency | Latency with its 90th percentile. |
| P95 Latency | Latency with its 95th percentile. |
| P99 Latency | Latency with its 99th percentile. |
You can use the Slow Queries dashboard as follows:
-
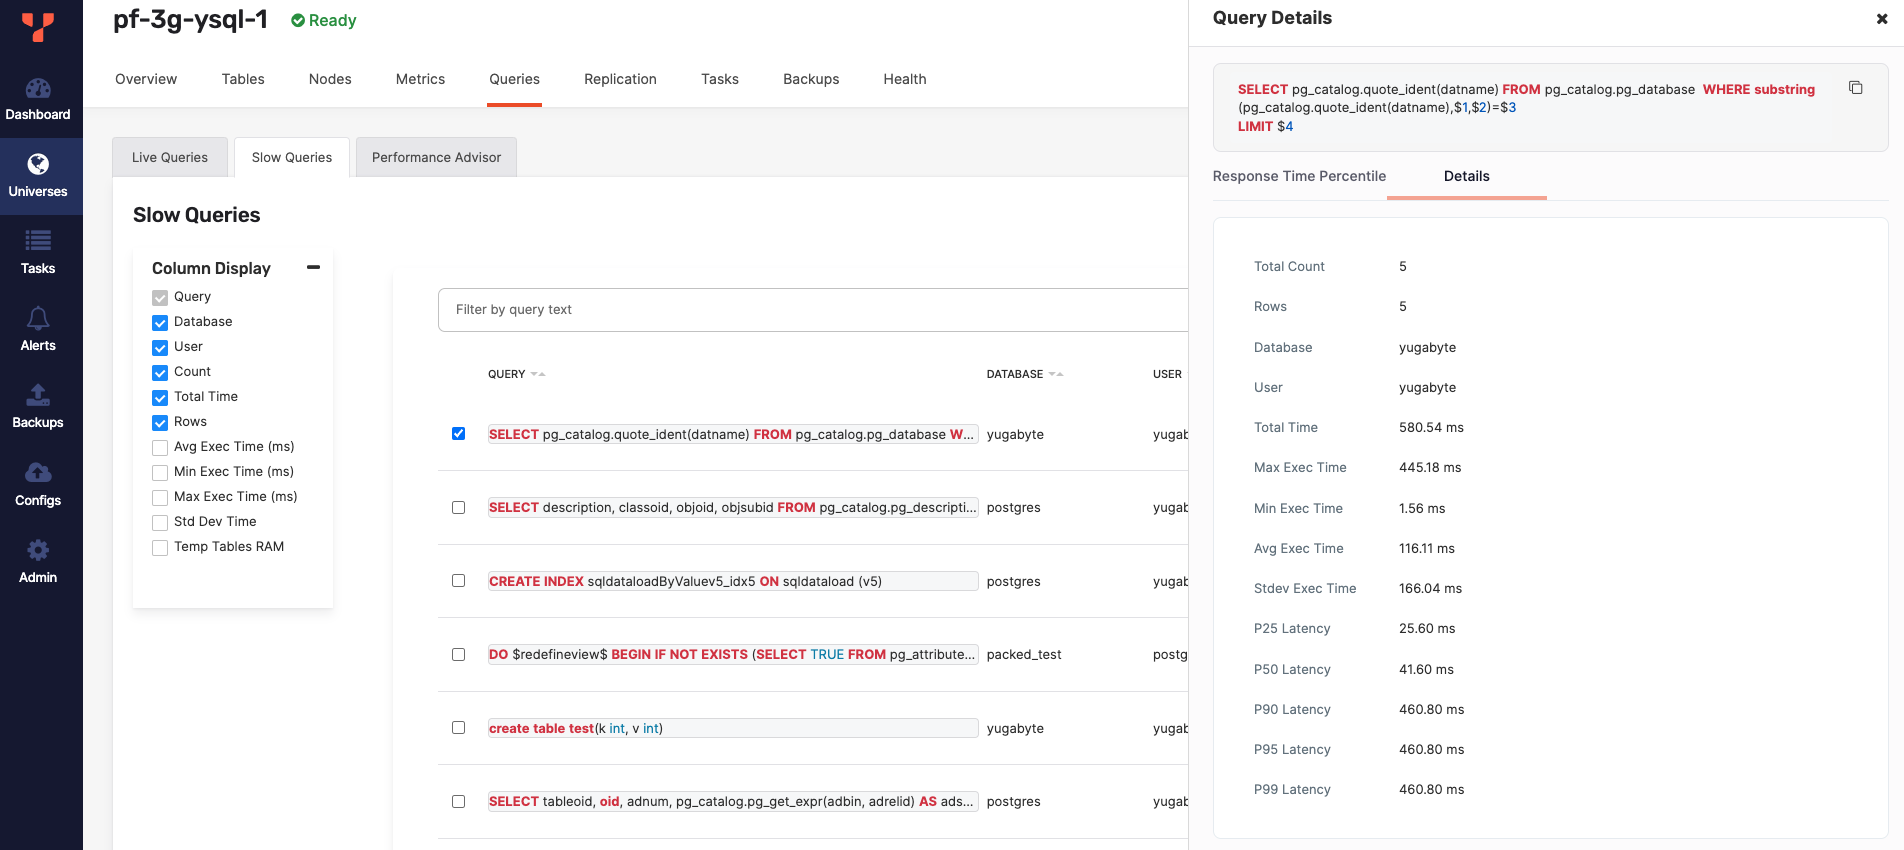
Navigate to Universes, select your universe, then select Queries > Slow Queries, as per the following illustration:
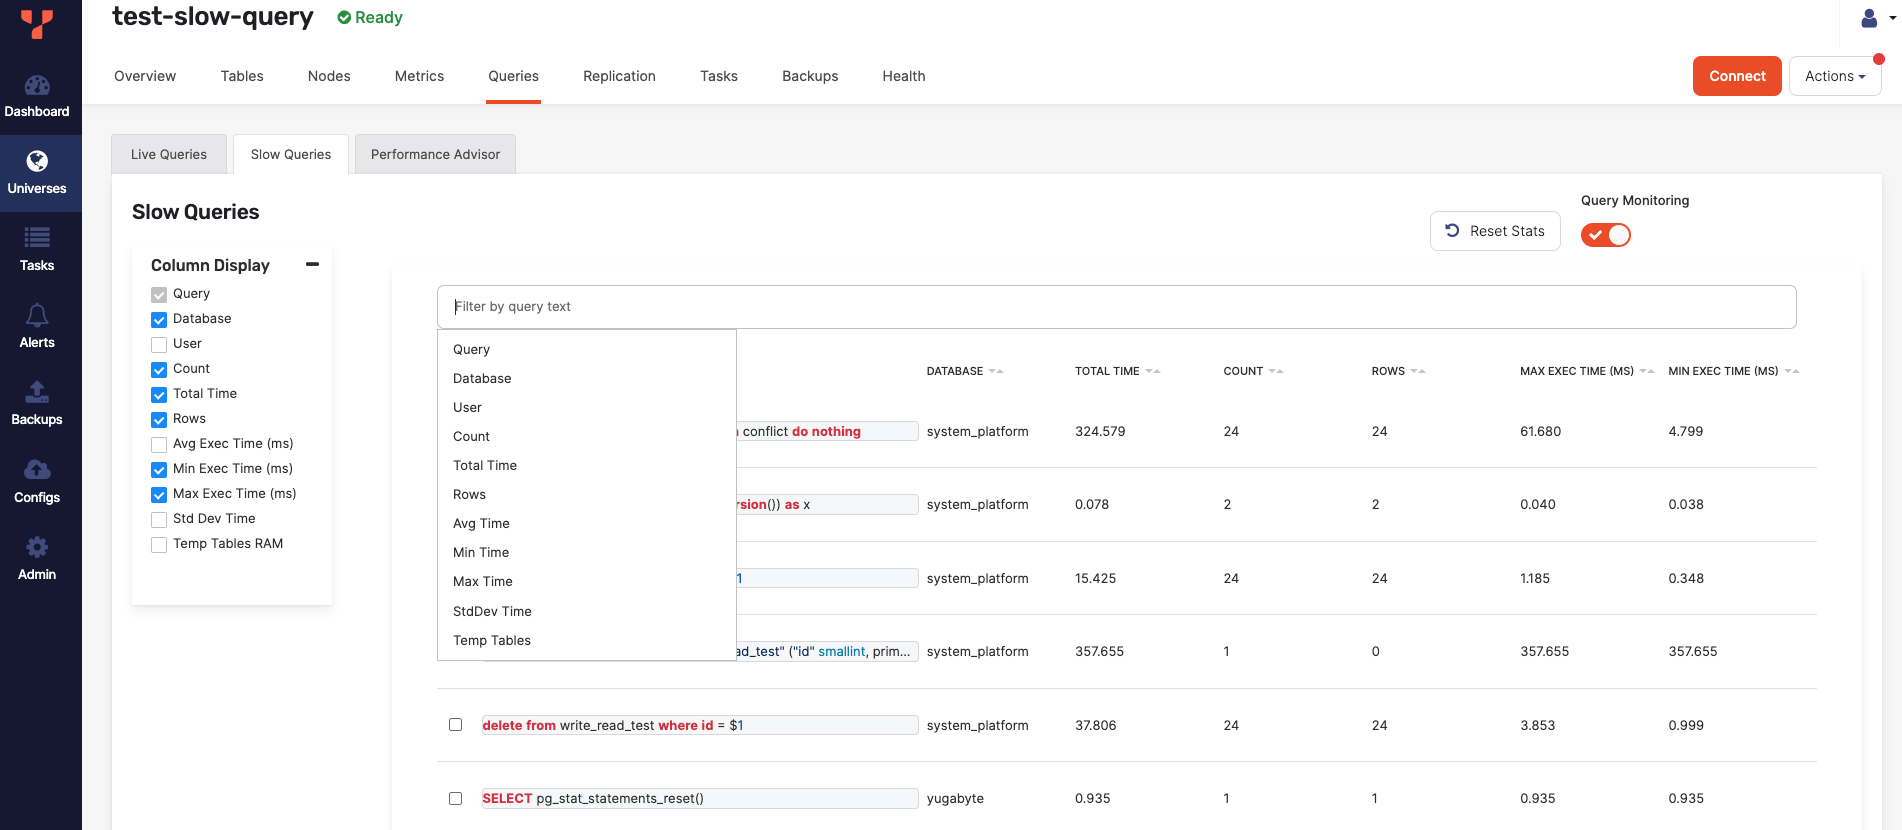
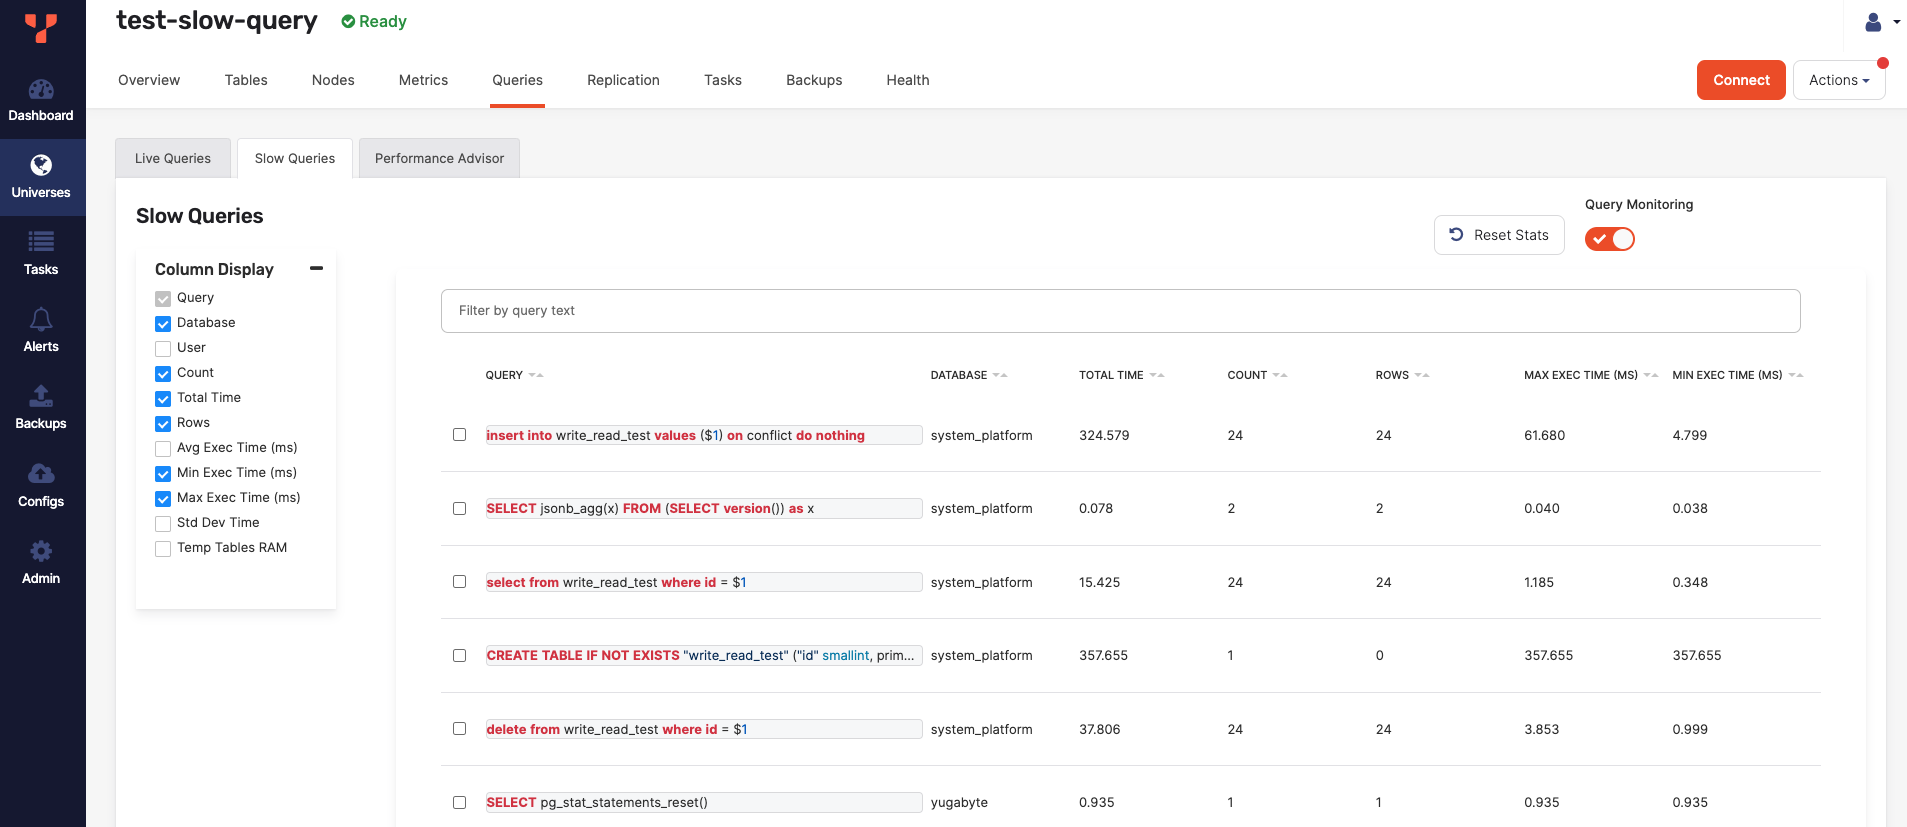
Note that you might need to enable query monitoring for your universe. If enabled, using Column Display allows you to dynamically display specific fields, as per the following illustration:
-
Click the filter field to be able to use a query language for filtering data based on certain fields, as per the following illustration:
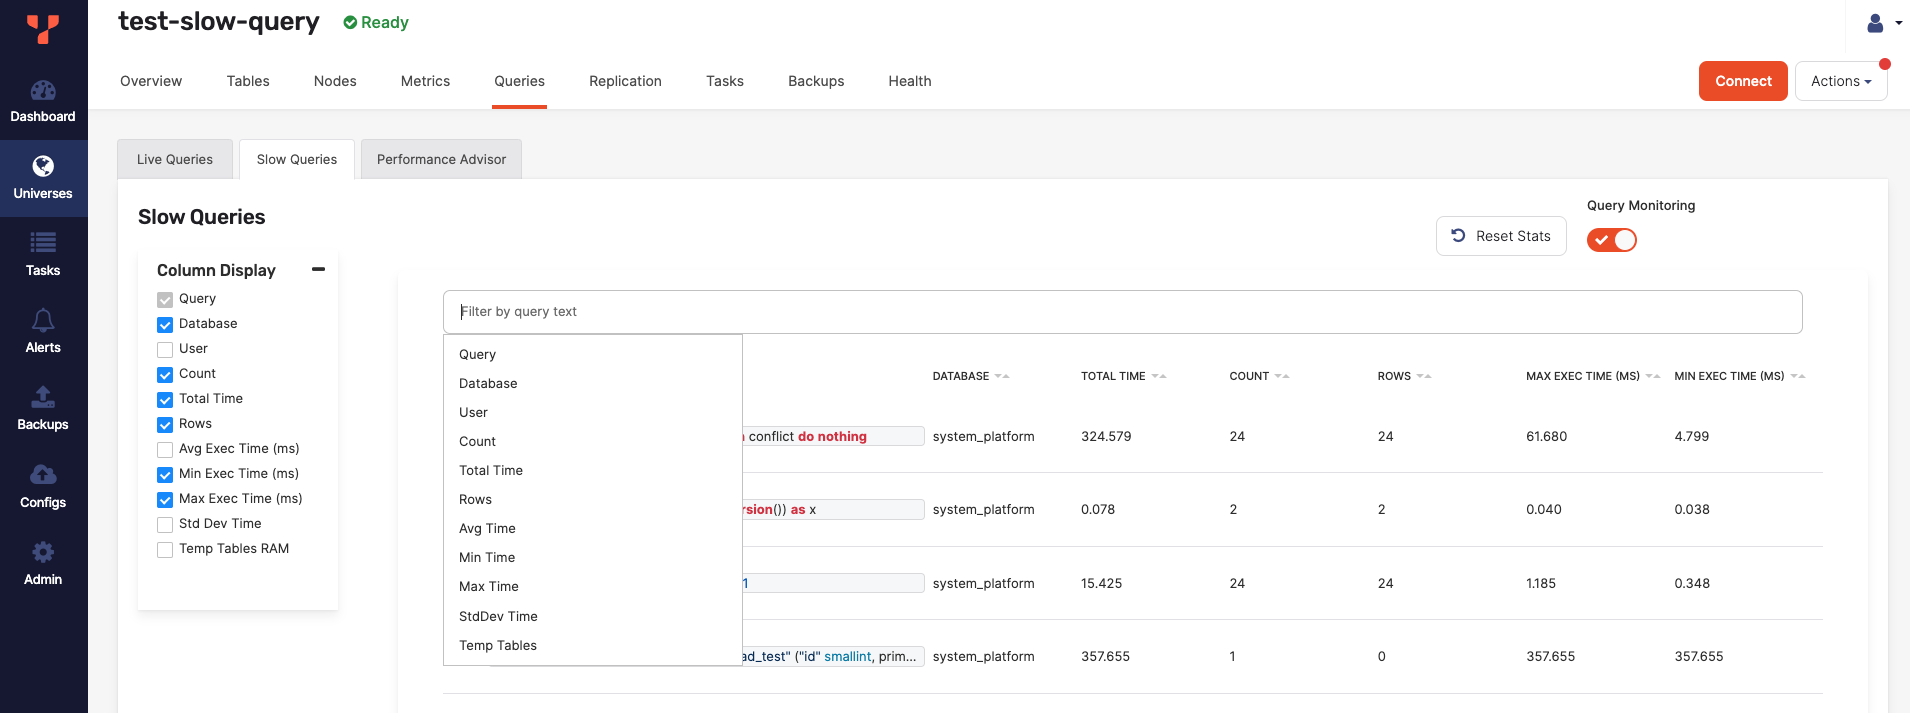
Use filtering for comparisons on numbers columns (
Avg Time) using>,>=,<, and<=to search for values that are greater than, greater than or equal to, less than, and less than or equal to another value (Avg Time: < 30). You can also use the range syntaxn..mto search for values within a range, where the first numbernis the lowest value and the second numbermis the highest value. The range syntax supports tokens like the following:n..*which is equivalent to>= n. Or*..nwhich is the same as<= n. -
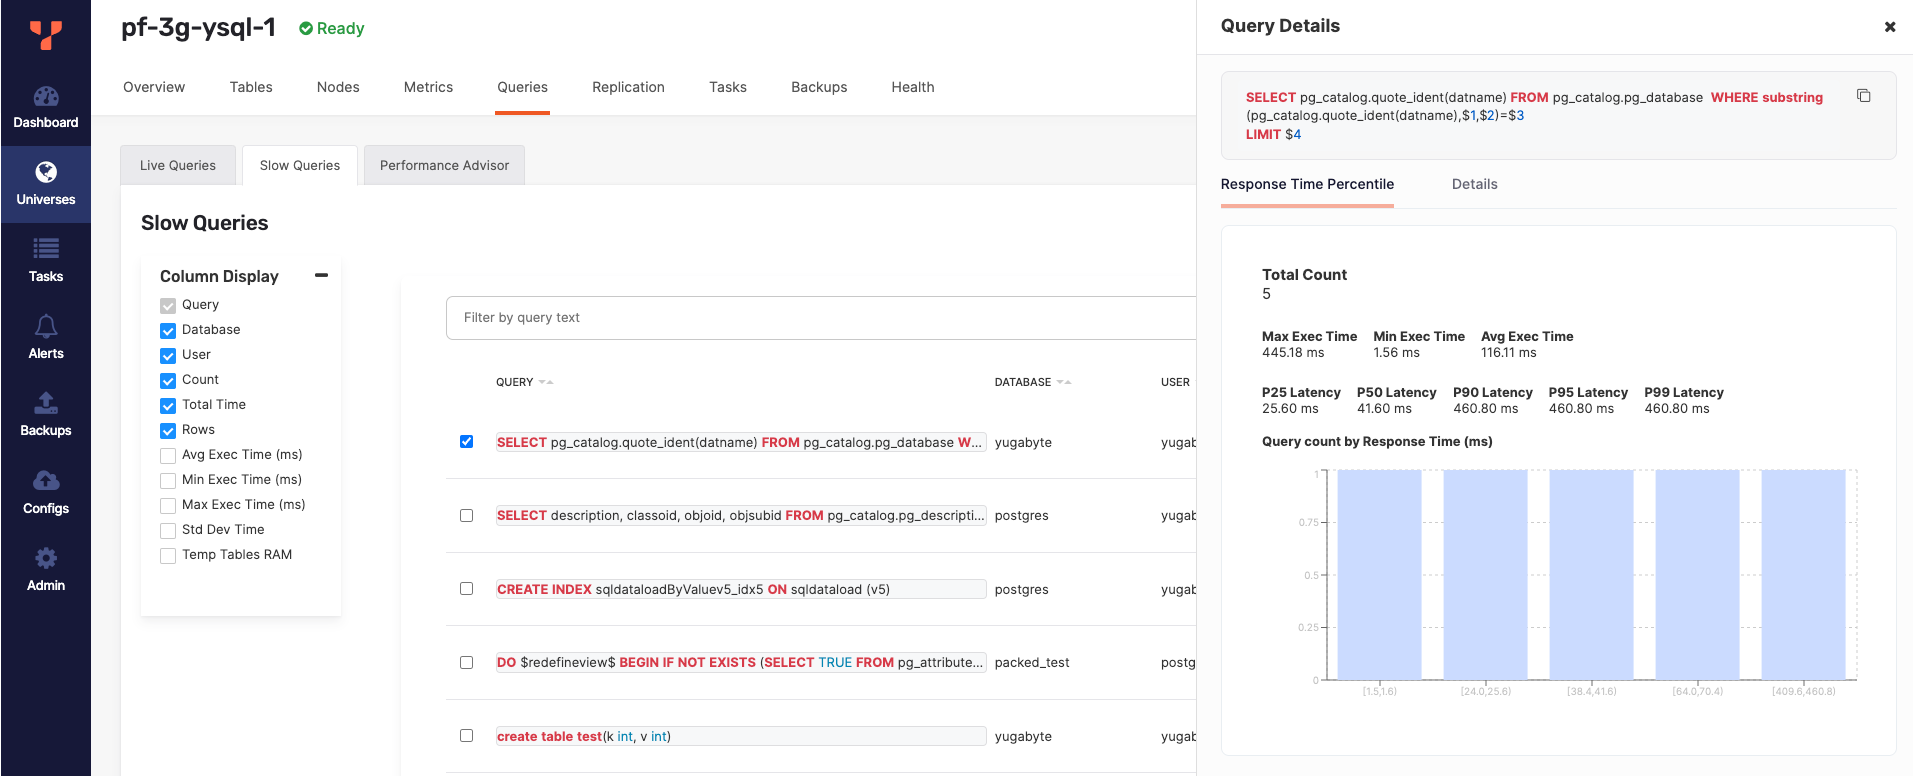
Select a row to open the Query Details with a full view of the query statement, along with all the column data, including the Response Time Percentile and Latency histogram.
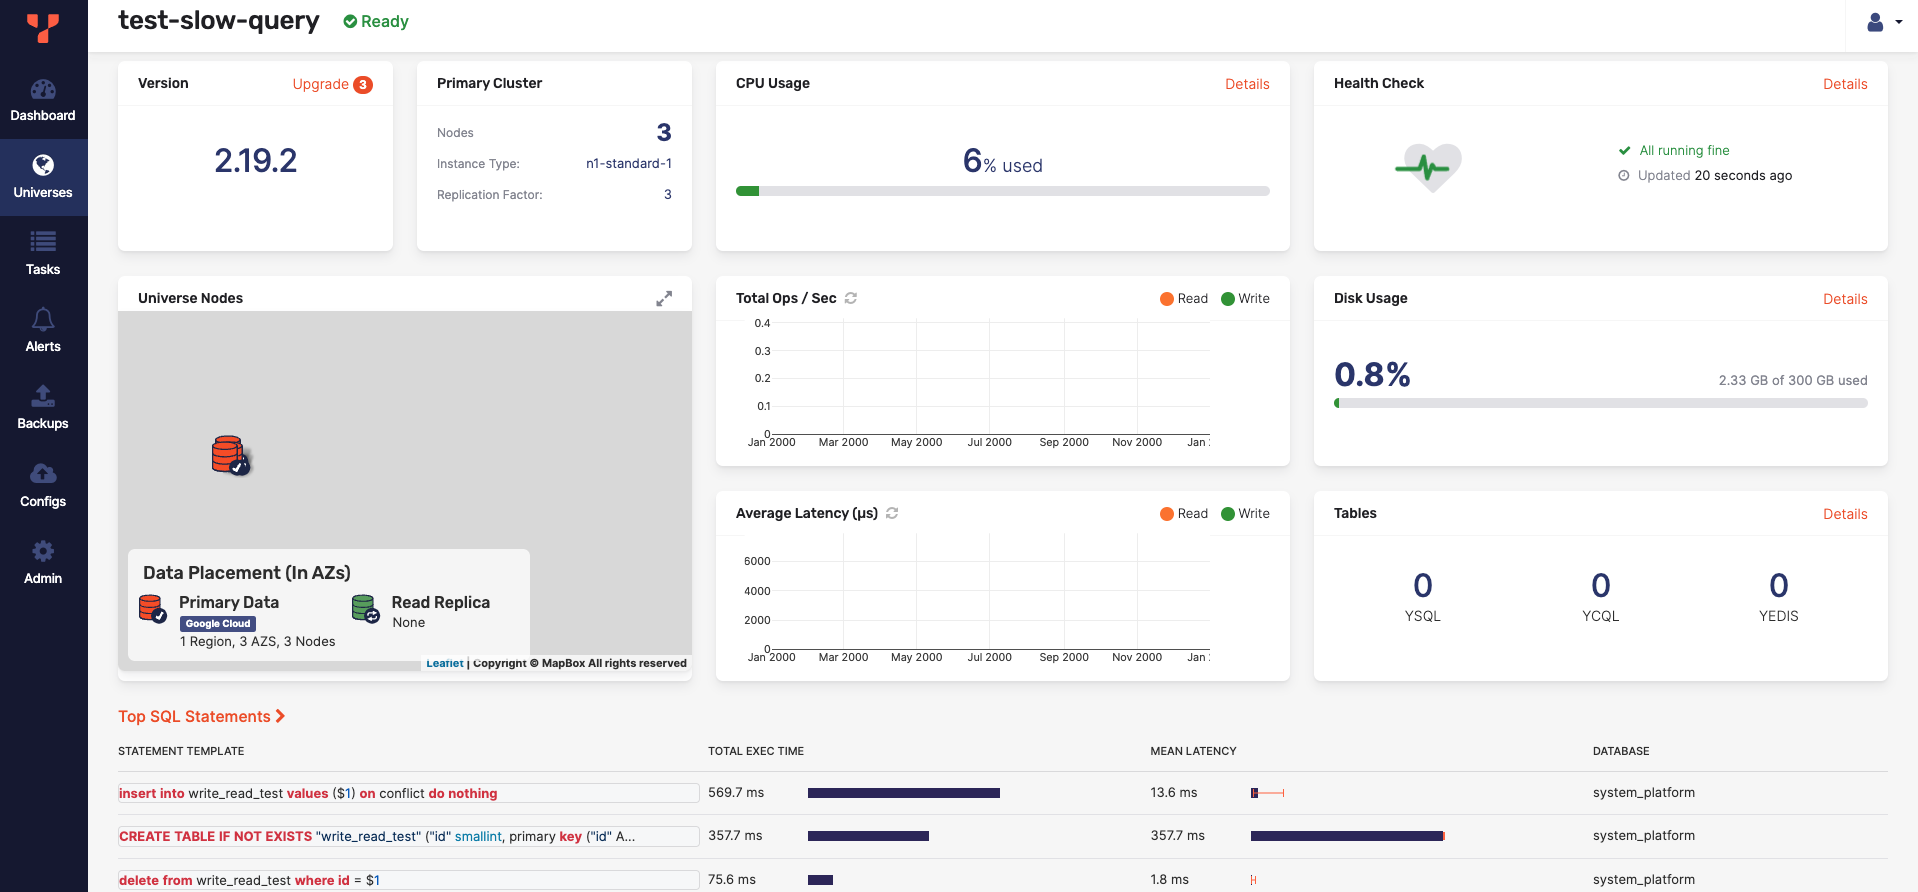
You can find additional prefiltered navigation links from different pages to the Slow Queries page. For example, from the Overview page to the Queries page, when you click the link to Top SQL Statements, as per the following illustration:
You can also access slow queries from each node in the Nodes page by clicking its Actions button.