Export metrics
You can export cluster metrics to third-party tools for analysis and customization. Exporting metrics for a cluster is a two-stage process:
- Create an export configuration. An export configuration defines the settings and login information for the tool that you want to export your metrics to.
- Assign a configuration to the cluster. Once created, you can assign an export configuration to one or more clusters. While the connection is active, metrics are automatically streamed to the tool.
Currently, YugabyteDB Managed supports export to Datadog, Grafana Cloud, and Sumo Logic. Metrics export is not available for Sandbox clusters.
Exporting metrics counts against your data transfer allowance. This may incur additional costs for network transfer, especially for cross-region and internet-based transfers, if usage exceeds your cluster allowance. Refer to Data transfer costs.
Prerequisites
Datadog
The YugabyteDB Managed Datadog integration requires the following:
- Datadog account
- Datadog API key
Grafana Cloud
- Grafana Cloud account and stack. For best performance and lower data transfer costs, deploy your stack in the region closest to your cluster. For a list of supported regions, see the Grafana Cloud documentation.
- Access policy token. You need to create an Access policy with metrics:write scope, and then add a token. For more information, see Grafana Cloud Access Policies in the Grafana documentation.
Sumo Logic
- Create an access ID and access key on the Preferences page under your profile name.
- Installation token. These are available under Administration > Security > Installation Tokens.
- To use the dashboard template, install the YugabyteDB app (coming soon) in your Sumo Logic account.
Export configuration
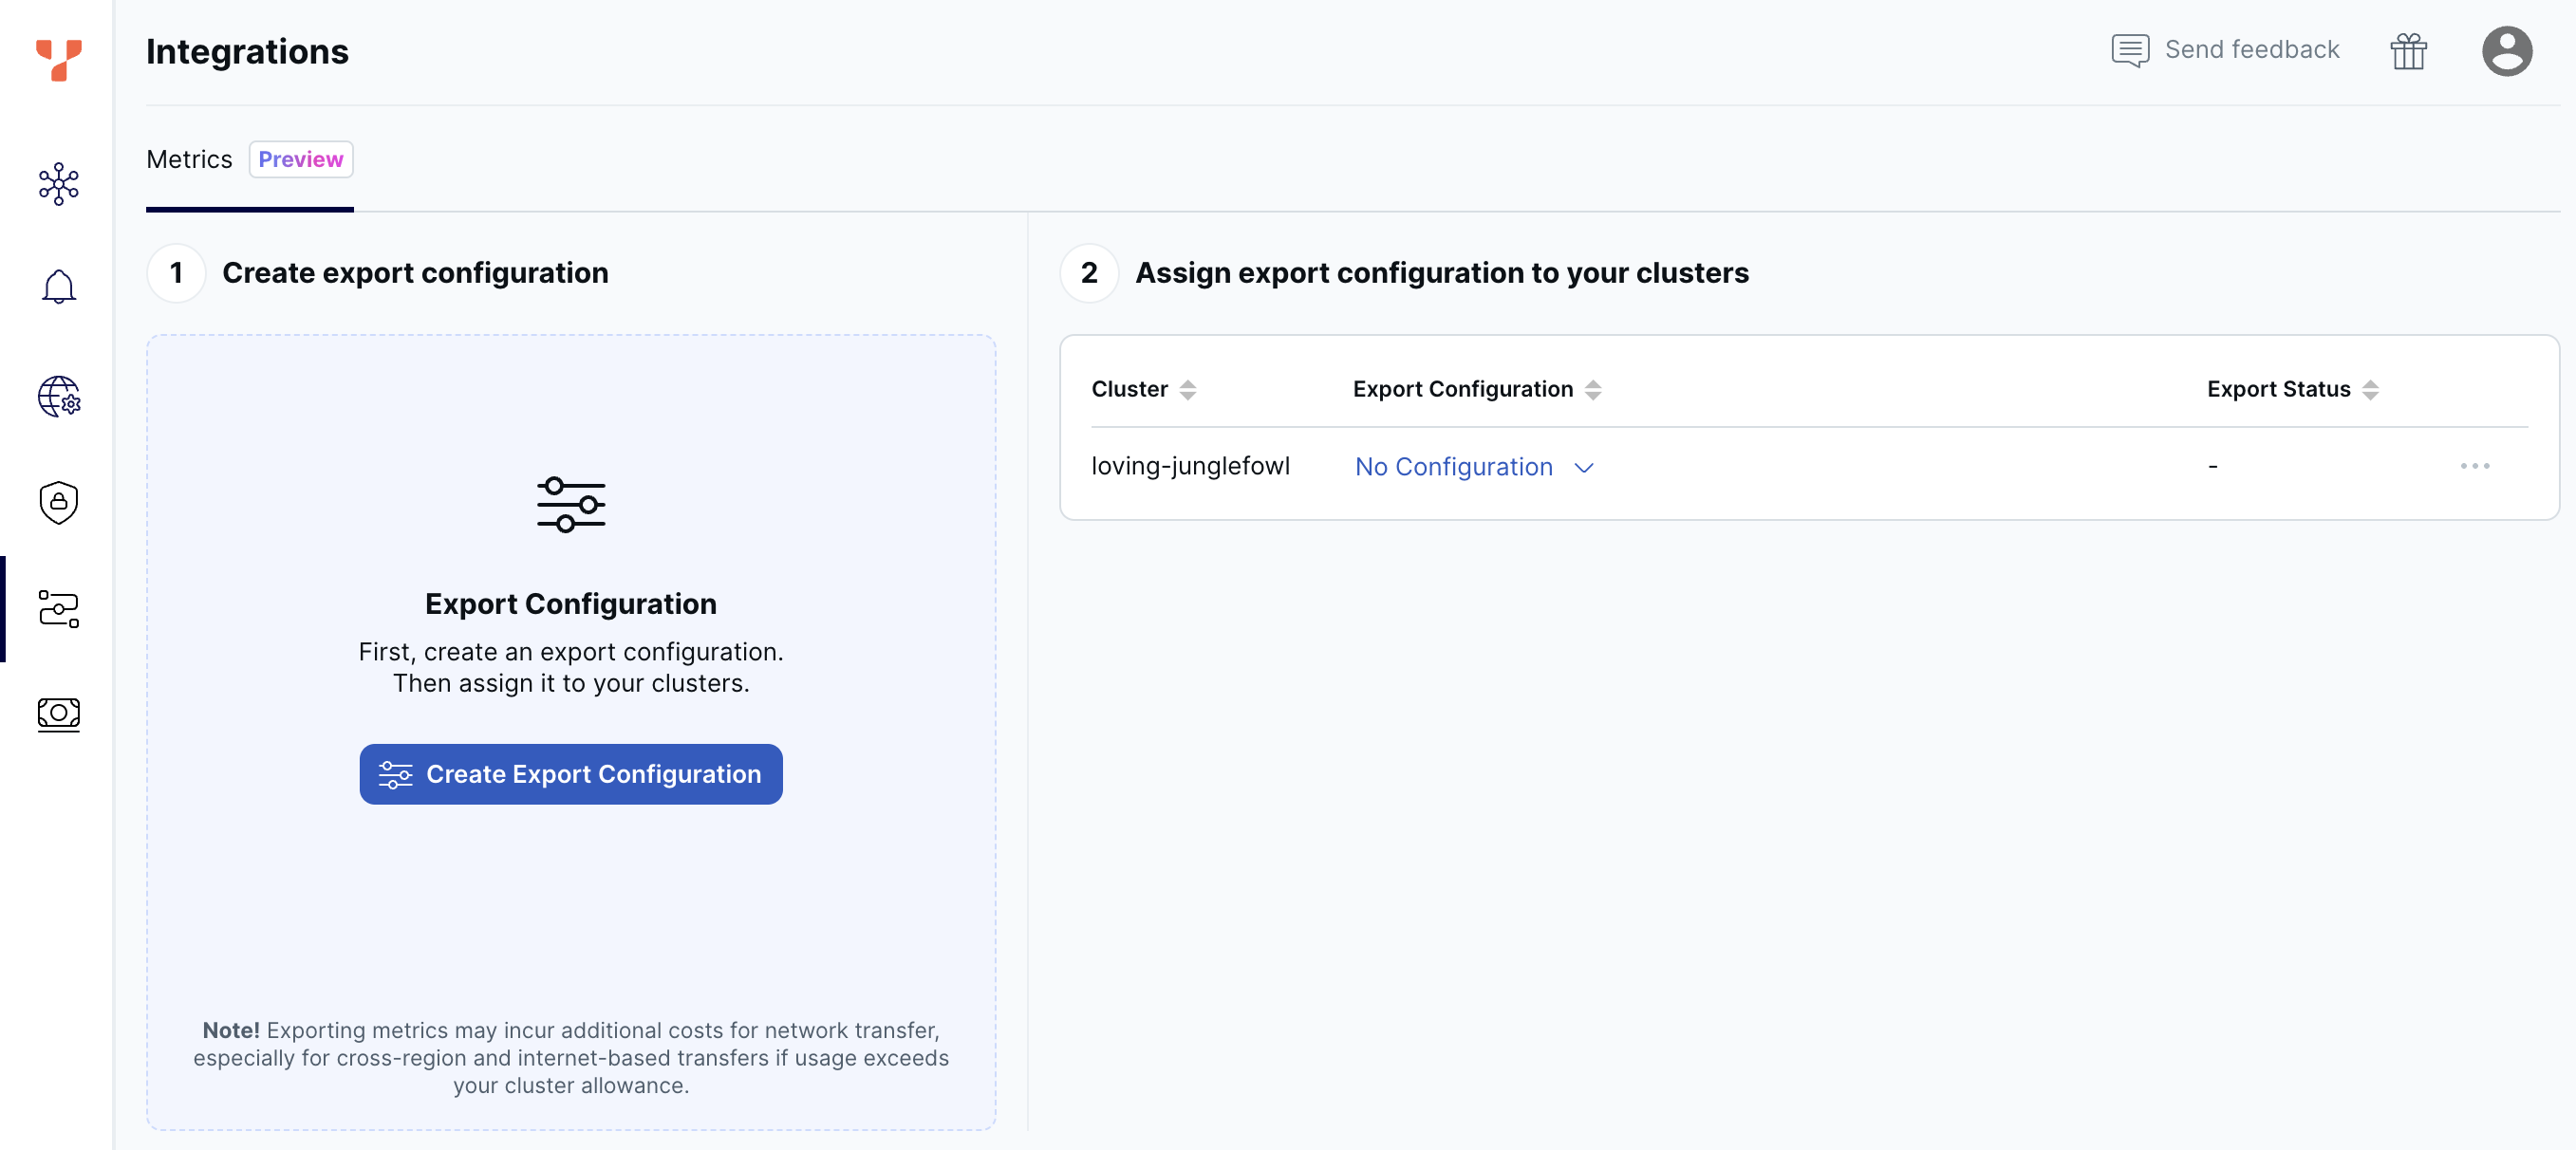
Create export configurations and assign them to clusters on the Integrations > Metrics tab.

The tab lists any export configurations that you have created, along with the clusters in your account, and the status of any metrics export that has been assigned.
You can also access metrics export on the cluster Settings tab under Export Metrics.
Manage export configurations
You can add, edit, and delete export configurations. You can't delete a configuration that is assigned to a cluster.
To create an export configuration, do the following:
- On the Integrations page, select the Metrics tab.
- Click Create Export Configuration or, if one or more configurations are already available, Add Export Configuration.
- Enter a name for the configuration.
- Choose Datadog.
- Enter your Datadog API key.
- Choose the Datadog site to connect to, or choose Self-hosted and enter your URL.
- Optionally, click Download to download the Datadog dashboard template. You can import this JSON format template into your Datadog account and use it as a starting point for visualizing your cluster data in Datadog.
- Click Test Configuration to make sure your connection is working.
- Click Create Configuration.
To create an export configuration, do the following:
- On the Integrations page, select the Metrics tab.
- Click Create Export Configuration or, if one or more configurations are already available, Add Export Configuration.
- Enter a name for the configuration.
- Choose Grafana Cloud.
- Enter your organization name. This is displayed in the URL when you connect to your Grafana Cloud Portal (for example,
https://grafana.com/orgs/<organization-name>). - Enter your Grafana Cloud Access policy token.
- Enter your Grafana Cloud instance ID and zone. Obtain these by navigating to the Grafana Cloud portal, selecting your stack, and on the Grafana tile, clicking Details. They are displayed under Instance Details.
- Optionally, click Download to download the Grafana Cloud dashboard template. You can import this JSON format template into your Grafana account and use it as a starting point for visualizing your cluster data in Grafana. The dashboard is also available from the Grafana Dashboards page.
- Click Test Configuration to make sure your connection is working.
- Click Create Configuration.
To create an export configuration, do the following:
- On the Integrations page, select the Metrics tab.
- Click Create Export Configuration or, if one or more configurations are already available, Add Export Configuration.
- Enter a name for the configuration.
- Choose Sumo Logic.
- Enter your installation token, access ID, and access key.
- Optionally, click Download to download the Sumo Logic dashboard template. After you install the YugabyteDB app (coming soon) in your Sumo Logic account, you can import this JSON format template and use it as a starting point for visualizing your cluster data.
- Click Test Configuration to make sure your connection is working.
- Click Create Configuration.
To edit a configuration, click the ... button on the configuration and choose Edit.
To delete a configuration, click the ... button on the configuration and choose Delete.
Manage cluster metrics export
You can assign a metrics configuration to one or more clusters to begin exporting metrics from those clusters. You can also pause and resume metrics export for a cluster.
To assign an export configuration to a cluster, in the Export Metrics by Cluster table, in the Export Configurations column, choose a configuration for the cluster.
To remove an export configuration from a cluster, in the Export Metrics by Cluster table, set the Export Configurations column to None.
To pause or resume metrics export from a cluster, in the Export Metrics by Cluster table, click the ... button for the cluster, and choose Pause or Resume.