Grafana dashboard
You can create dashboards for your local YugabyteDB clusters using Grafana, an open source platform to perform visualization and analytics which lets you add queries and explore metrics to customize your graphs.
To create dashboards, you need to add Prometheus metrics as a data source in Grafana. The visualization it provides gives a better understanding of the health and performance of your YugabyteDB clusters.
In this tutorial, you use Grafana to populate dashboards with the metrics you collect using the Prometheus integration.
Prerequisite
This tutorial requires a local multi-node universe with an instance of Prometheus displaying the metrics of your YugabyteDB cluster. Use the Prometheus setup you created for the Prometheus integration example.
Set up Grafana and add Prometheus as a data source
To set up Grafana with Prometheus as a data source, do the following:
- Install Grafana and start the server according to the Grafana documentation.
- Open the Grafana UI on http://localhost:3000. The default login is
admin, with a password ofadmin. - Follow the steps in Grafana support for Prometheus to create a Prometheus data source.
Create a dashboard
There are different ways to create a dashboard in Grafana. For this tutorial, you use the import option and pick the YugabyteDB community dashboard present under the list of Grafana Dashboards.
-
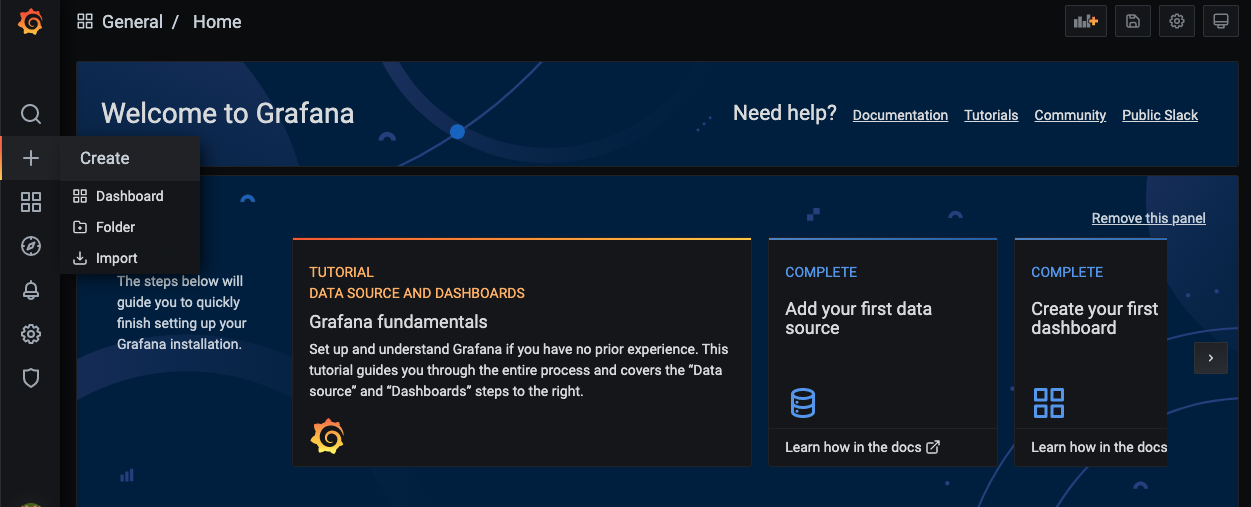
On the Grafana UI, click the + button and choose Import.
-
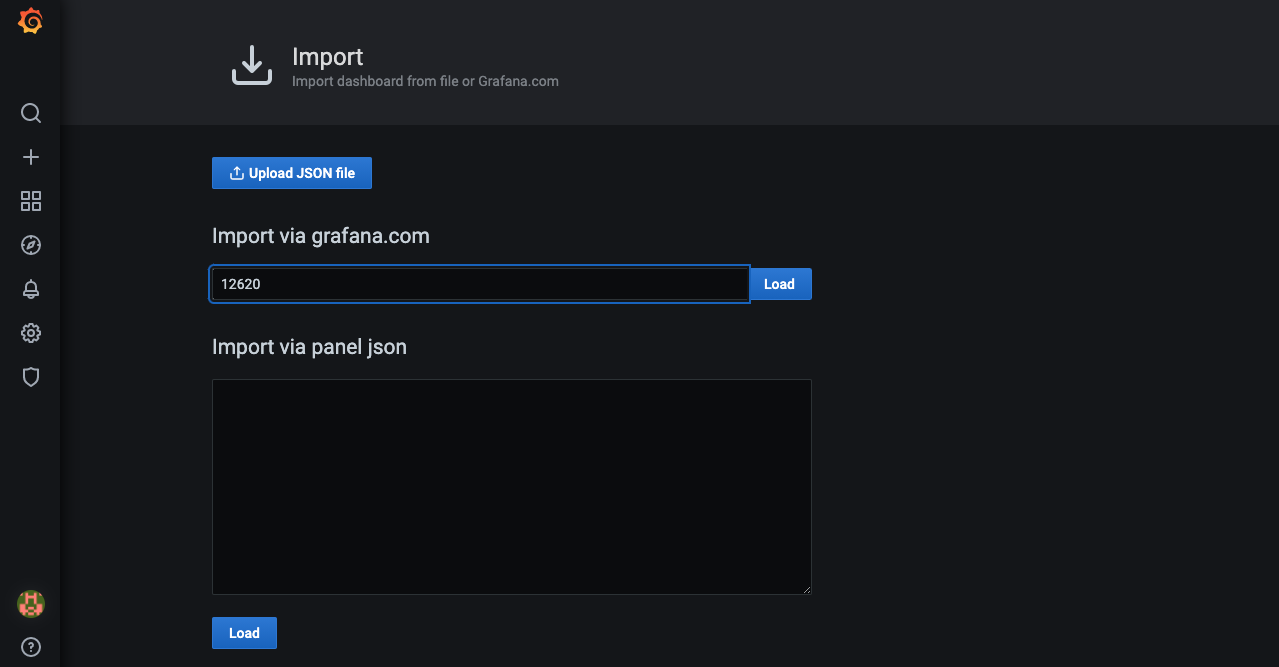
On the next page, enter the YugabyteDB dashboard ID in the Import via grafana.com field and click Load.
-
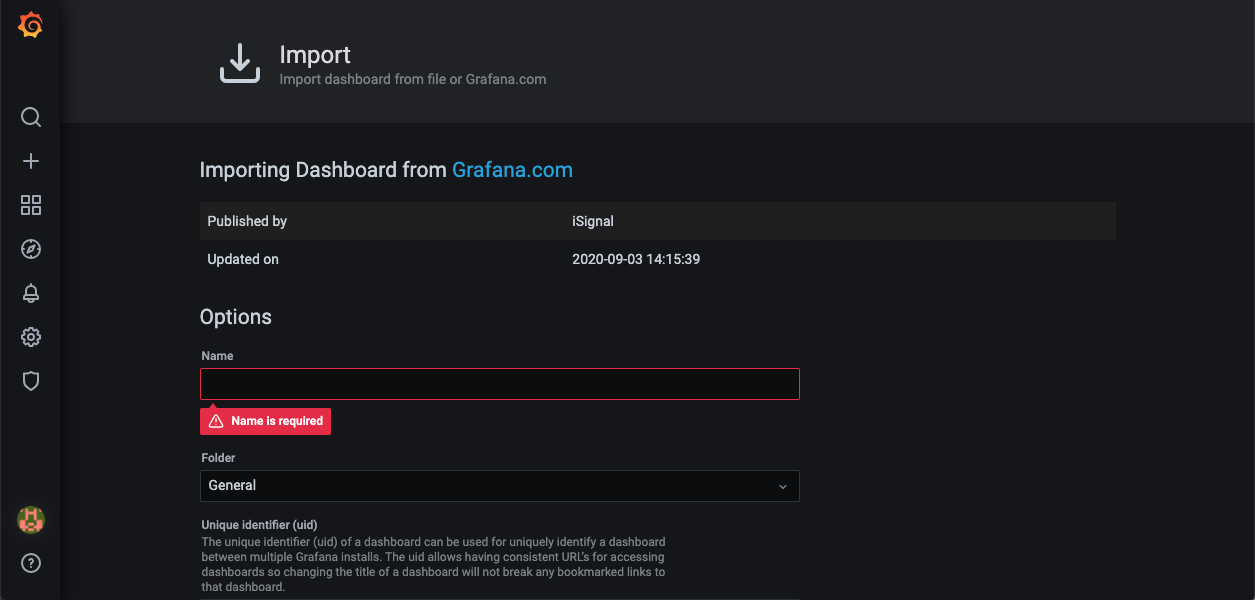
On the next screen, provide a name for your dashboard, a unique identifier, and the Prometheus data source. Be sure to choose the data source you created earlier.
After clicking Import, you can see the new dashboard with various details, starting with the status of your YB-Master and YB-TServer nodes. The metrics displayed are further categorized by API types (YSQL, YCQL) and by API methods (Insert, Select, Update, and so on).
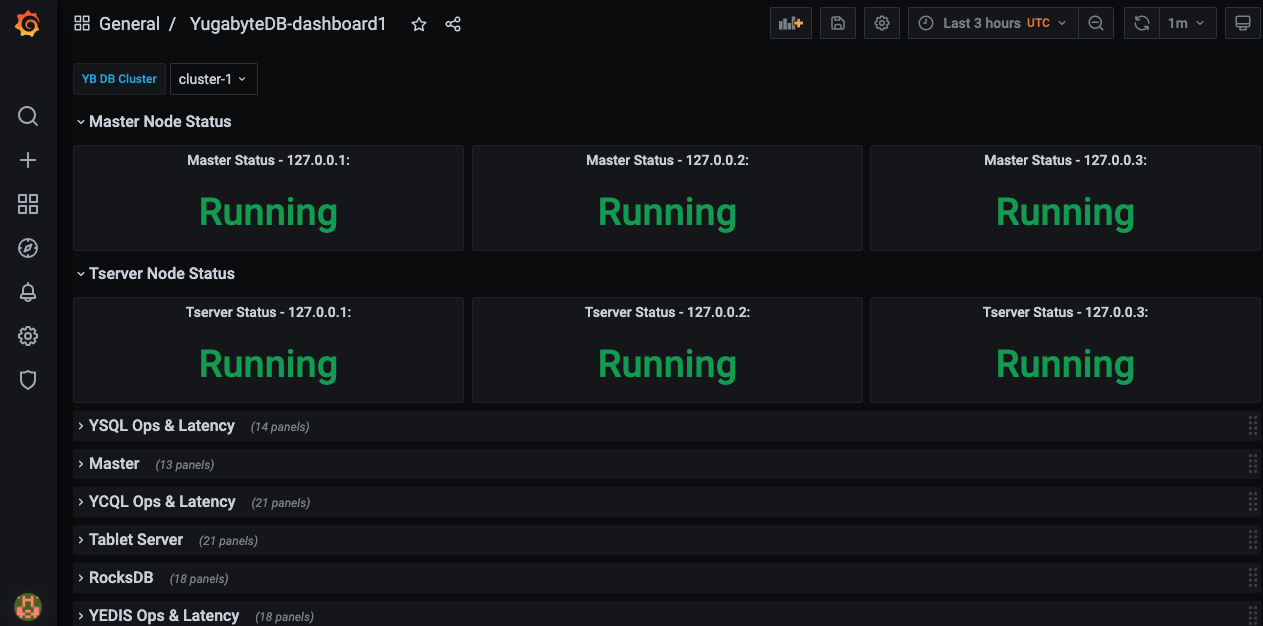
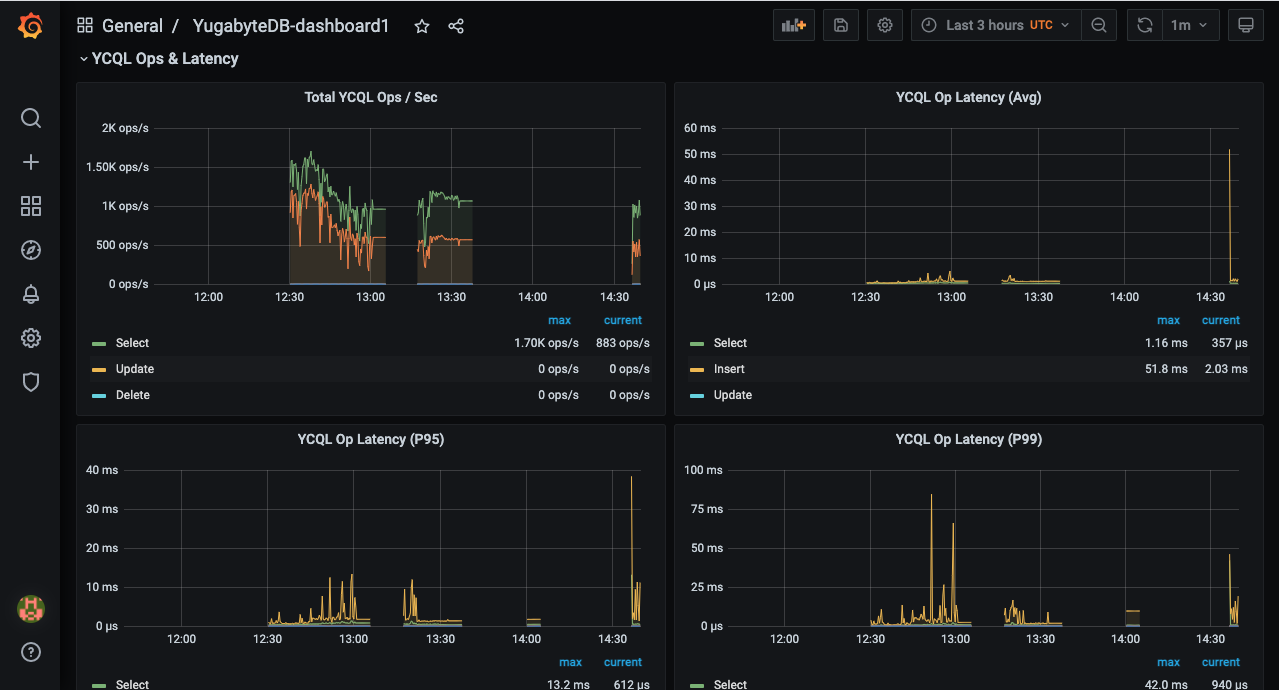
Because this example uses the CassandraKeyValue workload generator from the Prometheus integration page, you can see different YCQL-related metrics in addition to the YB-Master and YB-TServer statuses. The source code of the application uses only SELECT statements for reads and INSERT statements for writes (aside from the initial CREATE TABLE). This means that throughput and latency can be measured using the metrics corresponding to the SELECT and INSERT statements.
The following illustration shows YCQL OPS and latency metrics:
Clean up
You can shut down the local cluster by following the instructions provided in Destroy a local cluster.